

VD 105: Herd Mentality
15 January 2026

Even though we’re already two weeks into the year, I’d still like to take a moment to wish everyone all the best for 2026. I hope it brings good health to you and your loved ones. Beyond that, I hope everyone continues to find success in their investment journeys and enjoys a year of strong returns.
In this issue:
Herd Mentality
Stock in focus: A tour of our portfolio
The Rationality Test: Adobe
What I’ve been reading these past few weeks
News from our companies
Doubler Portfolio update + 2025 annual review
Herd Mentality
After the turn of the year, a wave of fund letters traditionally arrives, explaining their 2025 results. I read an extensive selection of these letters, and it’s striking that many of those funds haven’t had it easy over the past five years. This is partly because I primarily follow value-oriented funds, but even quality and growth funds have found it difficult to keep pace with the World Index or the S&P 500.
My takeaway is that if your strategy didn’t have a strong “momentum factor” built in, you likely underperformed the indices.
Interestingly, these annual reviews are increasingly pointing to the rise of index investing, or “hammock investing.” I’ve shared my views on this more than clearly in the past. In fact, someone jokingly asked me if I had written Fundsmith’s letter this year. My reply was equally tongue-in-cheek: “great minds think alike.”
Not that I’d place myself on the same level as Terry Smith, but anyone thinking rationally today cannot ignore the risks. Some say Terry Smith has fallen from his pedestal now that he’s trailed the market for five years, despite holding a portion of the “Magnificent 7.” Unfortunately, every style goes through lean years, and even Fundsmith has to weather this storm. Does that mean their process no longer works? In my view, absolutely not. It’s simply part of the game, even if five years feels like a long time.
Past their prime?
Even Warren Buffett was written off several times during his long career as someone who was no longer “with it” or was past his prime. Every time, he came back stronger than ever. I see the same happening with Terry Smith, simply because their process, in my eyes, remains sound.
To explain this exceptionally long period of underperformance, we often look at blind passive investing as the reason why it’s taking longer this time. But perhaps the “active versus passive” debate is the wrong one to have. We should actually be making a different distinction: between investors who do their homework and those who don’t.
Among so-called active investors, there are many “index huggers.” Countless fund managers are instructed not to stray too far from their benchmark. If NVIDIA’s weight in the World Index (a widely used benchmark) is 6%, their fund is often allowed to deviate by a maximum of 50 basis points. So they end up at 5.5% or 6.5%, depending on their conviction. But the option to exclude NVIDIA entirely often isn’t there; the manager would simply be replaced by someone who does follow orders.
Similarly, among private active investors, there are unfortunately many who only chase headlines and hype without doing their homework. In a period dominated by the momentum factor, this obviously works well, which only inflates their self-belief. We’re currently seeing another surge in reports of retail investors considering quitting their jobs to trade full-time.
Because the flywheel of momentum and ETF investing reinforces itself, these strategies have shown exceptional performance. This attracts even more capital—money being pulled out of active strategies and flowing toward passive investing. This creates a double effect: positive momentum for the indices and negative momentum for active strategies and smaller stocks.
Herd Mentality
Ultimately, this can be summarized quite simply: it’s herd mentality. This behavior is hardwired into human nature and is certainly nothing new in the investment world. It wasn’t caused by ETFs or hammock investing. For as long as I’ve been active in the markets (since 1998-1999), I’ve seen this happen. Whether it’s the glorification of AI or the doom-mongering about Europe, herd behavior explains every market peak and trough.
Passive investing isn’t immune to this phenomenon either. The real question is how “passive” these investors will remain when the inevitable turning point arrives. That this turning point is coming is clear, for the simple reason that corporate earnings cannot keep up with the stock market’s rise indefinitely. At the end of the day, earnings and cash flow are what matter. Of course, the interest rate environment (and related inflation) has a major impact, but even that eventually translates into bottom-line figures.
While everyone sees the overvaluations in the market, that tells us very little about how 2026 will unfold. To play devil’s advocate: what is expensive can become even more expensive. We saw exactly that in 2025. We started that year with a historically high valuation for the S&P 500. The Shiller CAPE 10 was above 37; only in 1999 and 2000 was it higher, at 40.57 and 43.77 respectively. The ratio was double its historical average.
While the Shiller CAPE 10 is an excellent indicator for predicting returns over the next ten years (which will likely be lean), it says nothing about the next twelve months. It could go either way. 2025 was the best proof of this, as the ratio rose from 37 to over 40. Even that current level doesn’t automatically mean 2026 will be a terrible year; after all, the ratio could climb further to 43 or beyond. We only know that the next ten years will very likely be less rewarding than the ten-year period that started in 2025, or the years before that when the CAPE 10 was significantly lower.
No looking for excuses
None of the above is intended as a way to find excuses. I’m satisfied with the 8.8% return our “Double Your Portfolio” achieved in 2025, especially considering that an average of 30% of the portfolio was in cash, yielding nothing. The year could have been much better had we been 100% invested, but my sleep would have suffered. This way, I was at least ready to capitalize on opportunities as they arose. The difference you can make at those moments is far more decisive than the returns left on the table today.
The reason I invest for myself is because I want to know what I own. I see myself more as a business owner than an investor. To me, the stock market is merely a tool to buy those businesses. Furthermore, thanks to that very same herd mentality, the market regularly offers the chance to buy companies at much more attractive prices than you could ever negotiate in a direct transaction.
Those opportunities are certainly out there today in small caps, partly due to the hype surrounding passive investing. Below are a few charts from the J.P. Morgan report to support this.
Opportunities to be found!
First, let’s take a look at the chart regarding the different regions.
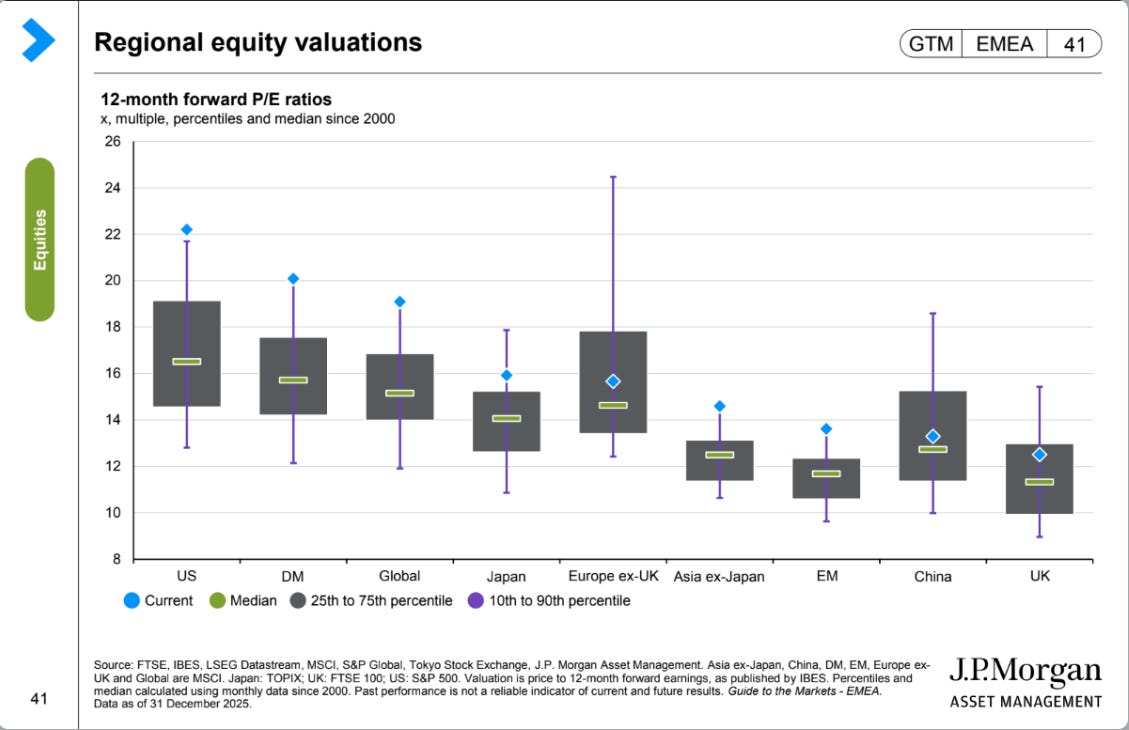
From this slide, it’s clear that all stock markets appear expensive when compared to their history since 2000. The US, in particular, is trading well above its long-term average and median, while Europe (excluding the UK) and China are more or less normally priced.
Personally, the valuation of the UK surprises me, especially since I often find interesting candidates there. I’ll dive into the reasons for that later on.
The valuation gap between Europe and the United States becomes even more evident in the chart below:
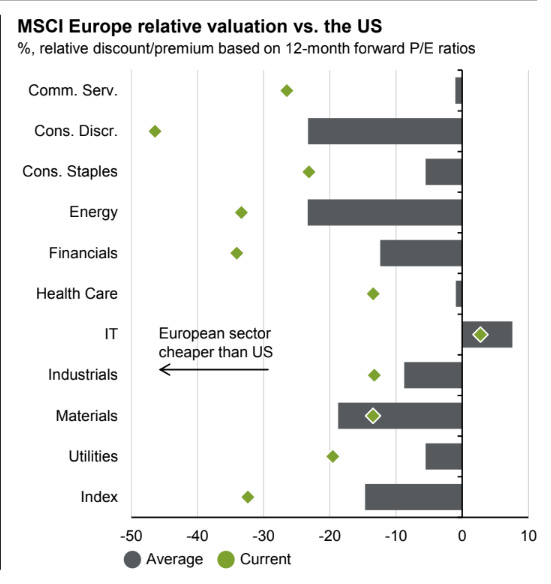
The relative valuation of sectors in Europe compared to their American counterparts deviates sharply from historical figures, with IT and Materials being the only real exceptions. In other words: investors are paying a much higher premium for the same earnings in US stocks than usual, or the discount for European companies’ earnings has deepened. Based on the first chart, it’s likely the former.
Another takeaway from the J.P. Morgan report is that market optimism remains high, particularly regarding earnings growth. This makes me question whether 2026 will truly be the year of more rational pricing.
However, the most relevant insight for us is found in the following image:
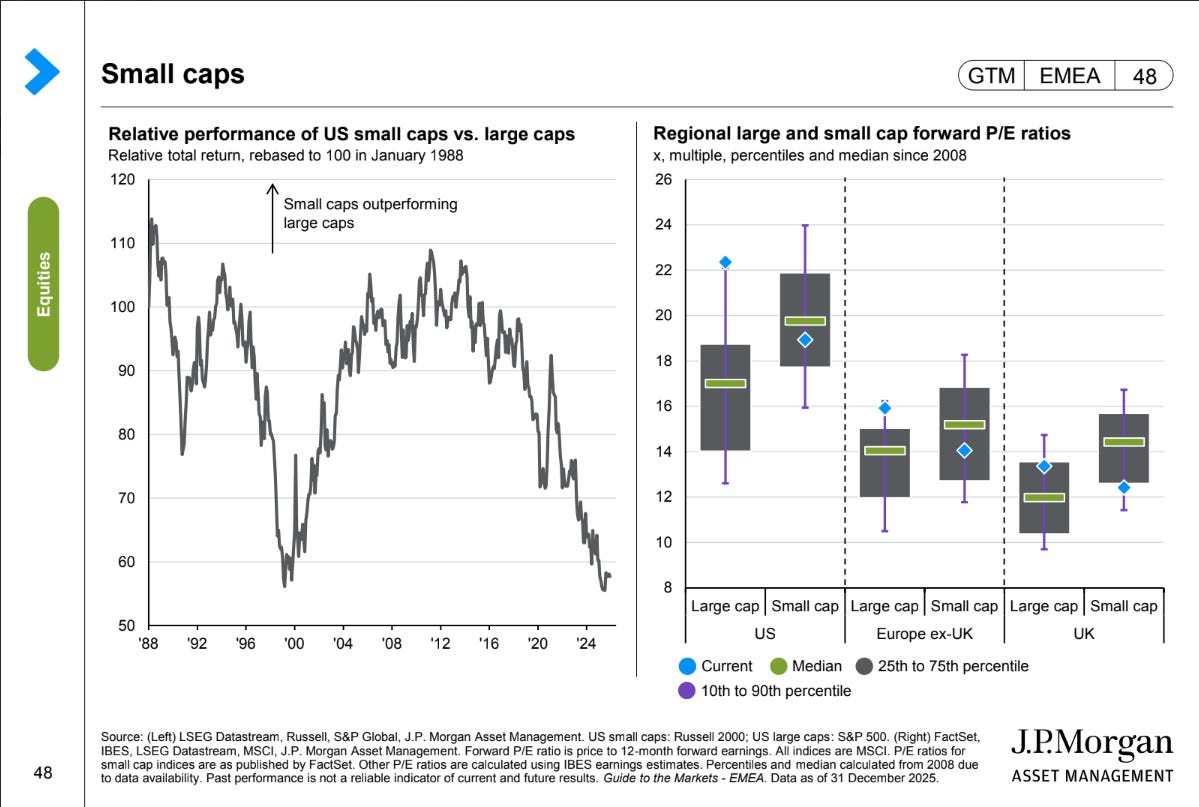
Looking at the first chart, it seems as though we are seeing a massive undervaluation of small caps compared to large caps. However, when we include the second part, it becomes clear that it’s not so much that small caps are heavily undervalued, but rather that large caps are extremely expensive.
Small caps aren’t historically expensive, but they aren’t dirt cheap either—except in the UK. There, valuations are truly below their median and average, which explains why I was surprised by the general market picture there.
I haven’t conducted specific research on this next conclusion, nor have I read any studies on it, but seeing these charts in combination with what I wrote above makes it crystal clear to me: passive investing is the primary cause of this valuation discrepancy between large and small stocks. Small caps simply aren’t included in the indices where passive money is flowing en masse. Small caps are more often the playground for active investors, who are becoming fewer in number and have frequently seen significant outflows due to poor performance in recent years.
My path for 2026
While we obviously don’t know how the markets will develop, my path for 2026 is clear for now. When opportunities arise, I will buy, but I remain cautious. The moment rationality returns, large-cap stocks will likely undergo a sharp correction and, in all probability, drag smaller stocks down with them.
Therefore, I only buy when I see a clear reason why the share price could rise within the next three years. If that’s not there, I’d rather keep my powder dry for another opportunity, which can undoubtedly be found among small and mid-caps.
It’s only a matter of time before the herd moves back toward “value.” Whether that shift begins in 2026 is a question we can only answer at the end of the year.
Keep reading with a 7-day free trial
Subscribe to Valuing Dutchman to keep reading this post and get 7 days of free access to the full post archives.