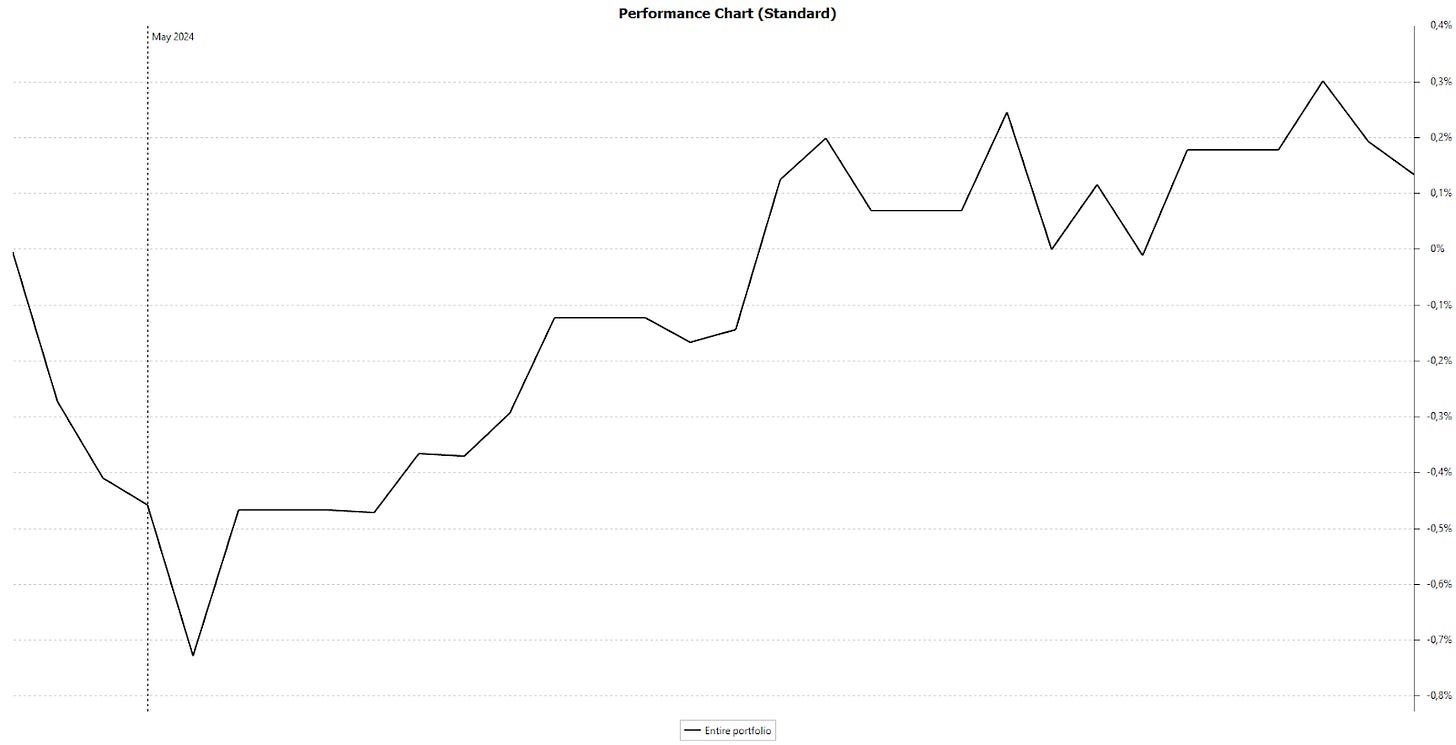
The Doubling Portfolio started a month ago. With about 24% of the capital invested, we have just been able to make up for the transaction costs (which, by the way, were considerable) in the past month. That's at least nicer than looking at negative numbers.
In this article
The market today
Doubler Portfolio overview
New transactions Doubling Portfolio
Current top five stocks
The market today
We don't look at the market to influence our investment decisions. We always take a so-called bottom-up approach, looking from the perspective of individual companies rather than top-down, from the market. If we find an interesting company, like the one proposed yesterday, we will buy it regardless of the overall market sentiment.
As I mentioned last time, however, it does help in putting certain positions and our performance relative to the market into perspective. Especially with cyclical companies, it's good to know where the market stands. Even if you were to compare with sector peers and think something is cheap based on that, it's interesting to know that, despite looking at the cheapest company in a sector, the entire market could still be expensive.
As you may already know by now, one indicator I find interesting is the so-called Buffett Indicator. This compares the total market capitalization of all listed companies in a country with the gross domestic product. Of course, there are counterarguments, especially regarding internet and tech companies, but it still provides an indication.
According to this indicator, we still see a strong overvaluation in the United States. The expected return for the coming years has dropped to 0.4%, including dividends. In other words, at best, we will likely see years of sideways markets there.
However, what also catches my attention is that the balance sheet of the Fed, the U.S. central bank, is starting to decrease, while the gross domestic product (GDP) continues to rise. Unfortunately, a large part of this growth is driven by inflation rather than volume growth or production gains. This will push up the prices of listed companies, but it won't make us richer; it will simply prevent us from getting poorer, unlike those who just leave their money in a savings account.
I also repeat what I wrote last time when I made this comparison. This indicator suggests that the total U.S. stock market is currently significantly overvalued. But as we now know, this is limited to a portion of the market. Even in America, bargains can be found among smaller companies.
The Shiller PE, another commonly used indicator to measure the market, is almost at one of its highest valuations ever for the S&P, at 34.5, nearly double its historical average of 17.5 and even higher than just before the great crash of 1929. Only during the dot-com bubble and in 2021 was it higher.
Although I didn't experience the Nifty Fifty period of the late '60s and early '70s, I still feel we're in a similar situation today. Back then, there were 50 companies that every investor had to have in their portfolio, companies you couldn't go wrong with. If you didn't have those big companies, including Coca-Cola, IBM, and Kodak, in your portfolio, you faced significant underperformance.
Today, we can repeat that if you don't have Nvidia, Apple, Microsoft, Amazon,... in your portfolio. Just like then, a part of the market today is very expensive, and another part is cheap. The result back then was that even fantastic companies, like Coca-Cola, remained below their peak prices for ten years or more.
It's not a question of whether these excellent companies will remain excellent, because most of these expensive companies are indeed top-notch. The question is what investors can expect as returns from these companies when you're already paying 50 times earnings, even if these companies are growing at a fast pace.
Moreover, you don't have to look only at America for this. In the Netherlands, we have ASML, and in Belgium, there's Lotus Bakeries. If we flip the question and instead of trying to determine the value of these companies, we look at the growth they need to sustain to justify current stock prices. For ASML, we see that if you want a 10% return on your investment, the company needs to grow by 31.4% over the next ten years. Over the past five peak years, it grew by 24.2%. In short, your return will be lower than 10%, even if it continues to perform very well.
For Lotus Bakeries, under the same assumption of wanting a 10% profit, a growth of 24.5% is needed, while over the past five years, it was 14.1%. Again, you can't say that the past five years were bad, so the company will have to perform even better than in the past five years to come close to a 10% profit.
I continue to opt for those cheaper companies that are at the right intersection between price and quality, even if it may yield less profit in the short term.
Doubler Portfolio overview
In the graph, we see the decline after the purchases due to the transaction costs. Then, the climb began until just above break-even. With the additional purchases we are planning now and the relatively high transaction costs, this will again dip just below our initial amount of €50,000. The current balance at the time of writing is €50,069.74. This is after all transaction costs and already includes some dividends.


