Portfolio and market overview June
The second month was not the right direction for the Doubler Portfolio, with a decline of 0.9%. This decrease is attributed to our construction-related companies. We also expected volatility from the two property developers, which is why we started with a slightly smaller position in them.
Furthermore, a decrease of 0.5% over two months is also not significant; it would be worrying if it were otherwise, considering we currently have only 29% of our portfolio invested. For this month, we are once again limiting ourselves to two new purchases: the stock presented yesterday and our car manufacturer.
In this article
The market today
Doubler Portfolio overview
New transactions Doubling Portfolio
Current top five stocks
The market today
Monthly, I will reiterate that observing the market is not intended to influence our investment decisions. We always take a bottom-up approach, focusing on individual companies rather than top-down from the market. If we find an interesting company, we will buy it regardless of the overall market outlook. This perspective is mainly for relative comparisons among competitors and to gauge where we are in the cycle for cyclical businesses.
If the overall market appears cheap, we may prioritize the highest quality companies at that time. It's useful to know where to focus when there are many opportunities, but currently, we are far from that point.
As you may already know, I find the so-called Buffett Indicator interesting. This compares the total market capitalization of all listed companies in a country with the gross domestic product. Of course, there are counterarguments, especially concerning internet and tech companies, but it still provides an indication.
While our portfolio experienced a slight decline, the US stock market continued to rise, led by NVIDIA and AI, further increasing overvaluation. The expected return at this market level has decreased to 0.1%, including an average dividend yield of 1.26%. In other words, sideways markets are expected for the coming years, at best.
A common theory in the stock market is that in a year of presidential elections, the market always rises, at least in America. Therefore, investors are not expecting a correction, making this theory a self-fulfilling prophecy.
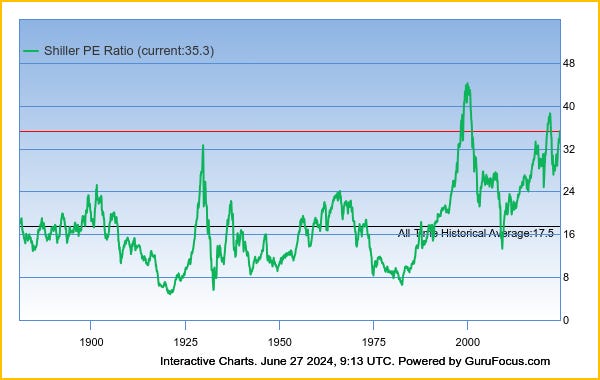
The Shiller PE, another frequently used indicator to measure the market, has been higher for the S&P 500 only twice before in history: in 2000 during the dot-com bubble and in 2021 after the COVID-19 hype. The fact that it was slightly lower in the late 1920s may be explained by the strong growth of the largest companies today, which justifies a somewhat higher PE, though not as high.
Last month, I already referred to the Nifty-Fifty period of the late '60s and early '70s. That sentiment has only been reinforced this past month. Only a few companies are of importance, companies that today have almost a cult-like following. Even among some ETF investors, it seems more like a religion rather than a rational approach.
Passive funds are often cited as part of the cause for these excessive valuations, or why the market seems "broken." I wouldn't go so far as to say that, but they do contribute to the extremes. When the market turns, they will amplify that movement.
There's a strong discrepancy between global markets. Belgium and England are among the cheaper markets, along with Spain and Australia. Interestingly, despite recent election setbacks, France hasn't become cheaper and still ranks among the more expensive markets, with an expected return of 2.2% for the coming years.
For me, the risk doesn't justify the many popular companies today, which is why I've started the 3P-check series, beginning with NVIDIA. Next week will feature a new 3P-check.
Both this market overview and the 3P-check are not meant to encourage exiting the market or selling. Their sole purpose is to take a rational look at the numbers and markets and maintain calm in times of euphoria and during panic.
However, the message today remains that there is a significant gap between very expensive and very cheap companies. Whether this normalizes, or whether it precedes a correction or persists with long sideways movements for those expensive stocks, only time will tell.
Doubler Portfolio overview
In the chart, it's clear when our stocks in the construction sector have declined.


