

Our portfolio as a company
We invest in companies, not "the stock market"

What do you feel most comfortable with? A carefully selected portfolio trading at 8.1 times earnings and 0.91 times book value, filled with profitable companies with low debt and long-term growth? Or an index of 500 companies for which you pay 27.9 times earnings?
Our focus is on investing in companies, not "the stock market." That’s our starting point. Let's look at our portfolio, considering all profits and assets based on our investments in the underlying companies, and treat them as real subsidiaries instead of trading products. We can determine the profit and assets of "our company."
In the comparisons below, I use our investment fund's portfolio, which is transparent and matches my own portfolio (and mostly aligns with our selection list), except for a buffer held in holdings and REITs.
From December 31, 2020, until today, earnings per share grew by 50.7% annually. Yes, you read that correctly: more than fifty percent per year.
Why from December 31, 2020, and not from the start date in early June 2020? Because we started with 100% in cash, and cash does not generate earnings. The portfolio still had to be built. Also, 2020 profits were negatively affected by the pandemic. If we compared profits from an earlier date to now, growth would be even greater. By December 31, 2020, nearly two-thirds of our assets were invested.
Let's look at the profits from December 31, 2021, onwards—when we can truly say the ramp-up period was over and the negative effects of COVID-related write-downs were mostly behind us. Over the almost three years that followed, we saw an average profit growth of 26.1% per share per year. Since the end of 2022, this has been 48.3%.
Manipulated profits? Both EBIT and EBITDA showed the same growth patterns, and the book value also increased significantly.
One technical note before we review the summaries:
The calculations are up to October 2, 2024. This means that 2024 is not yet a full year.
The available figures for 2024 are the LTM (last twelve months) figures, usually from July 1, 2023, to June 30, 2024.
These comments apply to both the portfolio and the mentioned companies.
An overview of the CAGR (Compounded Annual Growth Rate) of the portfolio:
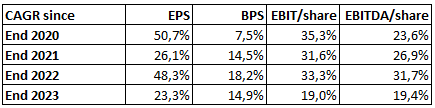
EPS = Earnings per share
BPS = Book value per share
Yes, you see that correctly: these are indeed impressive results, more like what you would expect from a tech company, not from a portfolio that mainly invests in simple and "boring" companies.
Let's compare this with a few companies, starting from December 31, 2021, to avoid the impact of COVID.

If we look at the growth figures of the Magnificent 7 and our Belgian pride, Lotus Bakeries, our "company" would rank third in profit growth, fifth in book value growth, third in EBIT, and second in EBITDA.
We can therefore say that our results match those of the Magnificent 7 and Lotus Bakeries.
Where does it go wrong?
Our portfolio does not match the price performance of these companies—not even close. Where does it go wrong?
Investors are willing to pay less and less for our companies, even though we bought them at low prices.
This is the trend of what has been paid for our portfolio on the stock market:

You can see the evolution from paying 1.94 times book value in 2020 to 0.91 times today. For earnings, it is even worse. The price-to-earnings ratio on December 31, 2020, was, of course, somewhat distorted by COVID, and there was still a lot of cash that generated no return. So, it's better to follow the trend from 2021 for the earnings figures.
For book value, however, €1 cash is also €1 book value, so we can track it from 2020.
As strange as it may sound, such abnormal trends are normal on the stock market. It’s also why we have always managed to achieve good profits in the past, by taking advantage of this irrationality. We need these periods to sow, so we can harvest later. It's just that the harvest is taking a long time this time.
Some more figures: the earnings per share of the S&P 500 (the 500 largest companies in the world's strongest economy) have been stagnant for three years. From $198 per share at the end of 2021 to perhaps $205 to $210 by the end of Q3 (those figures are not yet available).
The book value of the S&P 500? It grew from $1,008 to an estimated $1,130 over three years. That’s not impressive at all.
At the same time, investors are willing to pay 15% more for the same dollar of earnings from the S&P. This is a stark contrast to our portfolio, where 50% less is being paid for each euro of profit compared to three years ago. The S&P 500 trades at a PE of 27.9—more than three times that of our selection.
And then, if you compare what investors are willing to pay for the Magnificent 7.

Of course, we must be honest: the growth we achieved was mainly because we were able to buy all those profits at very low prices. Now that we are almost fully invested, our profit growth is limited to
the growth of the underlying companies and
the replacement of positions that have risen to or above fair value with new positions that are significantly undervalued
We are not looking at this through rose-colored glasses. The economy is slowing down in both Europe and the United States, which will impact profits, especially for our cyclical companies.
This is already happening: the profits of nearly half of the companies in our selection have decreased over the past twelve months. This is already reflected in the figures above and was expected when purchasing these companies. Only one company in our selection, Bonava, is unprofitable. This was, of course, factored into the investment thesis.
The evolution of the total book value of the selection, both in terms of growth and multiple, is clearer to observe. Profits can fluctuate significantly, but as long as there are profits, book value grows—some years faster than others.
Why this big difference?
Investors pay for future profits, not past ones. So, it's reasonable that we do not trade at the same multiples as growth companies, without getting into a debate about the assumptions behind those growth estimates.
But 8.1 times earnings for a selection of profitable companies with low debt and long-term growth potential? That is simply too cheap. I feel much more comfortable with such a selection than with an S&P 500 trading at 27.9 times earnings. After all, those companies are not immune to economically weaker times either.
feels very similar here.
I will share your article in my next news and updates.